Freshwater Inputs
The Severn Estuary catchment area (catchment meaning the area of land draining into the Estuary), covers an area of over 21,000 square kilometres. 80% of the river basin district around the estuary is used for agriculture and forestry.

Over 600 rivers drain into the Estuary, carving out a ‘blue motorway’ for boats, people and animals alike. The main rivers which drain into the Estuary are the Ely and the Taff (impounded by the Cardiff Bay Barrage), the Rhymney, Ebbw, Usk, Wye, the Severn, the Avon and the Parrett. The River Severn is the longest in Great Britain, travelling for 180 miles (290 kilometres) before emptying into the Severn Estuary.
Freshwater input is a way of measuring the amount (volume) of freshwater entering the Estuary. Once rivers reach the Estuary, the freshwater from the rivers mix with more salty (saline) seawater to create a brackish environment. Another source of freshwater to the Estuary comes from groundwater. Groundwater is freshwater stored within pores or fractures of rocks, and can be quite ancient in origin. The coast of the Estuary is made up of low permeability soils overlying low permeability bedrock. This means that groundwater cannot infiltrate easily – it would make a poor area for a well. As such, there is limited groundwater resource potential in this area and no major principle aquifers4 except those in Carboniferous Limestone, where groundwater moves within fractures. Water along the coast is usually transported by surface processes instead, such as overland flow. Springs also occur along the land and within the Estuary itself, including the Great Spring (intercepted by the Severn Railway Tunnel).
As well as input from rivers, the Severn Estuary also obtains freshwater from man-made watercourses. Of particular note are the man-made drainage channels in the bordering some of the lowest lying areas (the Levels) around the Estuary. These drainage channels (termed rhynes in England or reens in Wales), manage the water levels and drain water into the Estuary through ‘sea doors’. This technique has been used to manage water levels for hundreds of years, dating back as early as 1579 in Wembdon, Somerset .
Importance of freshwater flows into the Severn Estuary
The balance between freshwater and saltwater forms the unique brackish water environment of the Estuary. The ever-changing rates of water flow and tide levels continuously modify the physical, chemical and biological conditions of the estuary, providing challenges for estuarine dwellers. Many impacts may result from changes in freshwater inflow to an estuary. For example, a reduction in freshwater river flow may result in saline (salt) water and high silt levels extending further upstream. With reduced river flow into the Estuary, fewer nutrients, organic matter and dissolved oxygen reach the Estuary. These effects will be reversed with increased river flows. During periods of particularly heavy rainfall, there may be an increase in pollutants reaching the Estuary from sewer overflows and surface runoff.
The physical and chemical changes mentioned above are cues for migration both within the Estuary and into the surrounding rivers to complete a life cycle stage for many species. For example, when river flow decreases, adult salmon can swim upstream and enter the Wye and Usk rivers to spawn. In reverse, increases of river flow (known as ‘freshets’) allow juvenile migratory fish species to reach the ocean, such as lamprey. Lamprey begin life in rivers and migrate to the ocean upon adulthood. Change in salinity (saltiness) and temperature levels also influence animal migration, which are again affected by changes in flow to the freshwater Estuary. All these factors make the Severn Estuary a complex, dynamic and exciting system to have within the UK!
Flows of the main rivers feeding the Severn Estuary
Units – Water flow is commonly measured as the volume of water flowing at a given location every second. In small watercourses and at abstraction points, it is usual for the volumetric flow rate to be measured as litres per second (l/s). For larger flows it is normally measured in cumecs, or cubic meters per second (m3/s).
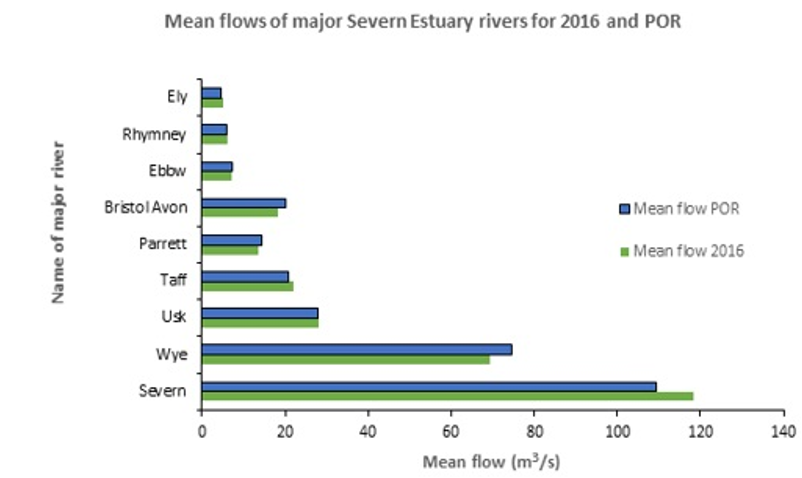
Table 1 shows flow data for the main rivers flowing into the Severn Estuary. There are numerous other water flows into the Estuary, but flow rates are usually below 1 cubic metre per second. As such, these smaller watercourses are not included in the table.
| River | Length | Peak Flow (maximum for 2018) |
| Severn | 180 miles (290 km) 329 m3/s | 329 m3/s |
| Wye | 130 miles (210 km) 487 m3/s | 487 m3/s |
| Usk | 78 miles (125 km) 514 m3/s | 514 m3/s |
| Avon | 83 miles (134 km) 99 m3/s | 99 m3/s |
Table 1 – Mean flows for the period of record (POR) and 2016 for the major rivers of the Severn Estuary. Length of POR varies for each river
Litter Picking Groups

Find out how you can help keep your local beaches, estuaries and bathing waters clean for everyone to enjoy.


Measuring river flows
River flow is measured and managed by the Environment Agency in England and Natural Resources Wales. This careful monitoring is undertaken with gauging weirs, measuring river flow and discharge, which means flood risk and water abstraction rates can be calculated. The weirs provide an accurate cross-section of the river, from which the relationship between water depth (called the ‘stage’) and river discharge is calculated. This monitoring equipment is housed in gauging stations, which sends on its recorded data to the appropriate monitoring bodies. Gauging stations are located above tidal limits of rivers, in order to take accurate data of river levels without the influence of tides. The stations are built in accessible locations, with access to power, supplies, and for the purpose of data collection. A flood warning station must be built in an area which can detect a flood long before it reaches any towns or cities. As such, the most downstream gauging system may be a large distance from the river mouth. This means that small areas of a catchment may not be monitored. For example, 5-10% of the Ely and Taff catchments in Wales drain into rivers downstream of the last gauging stations.
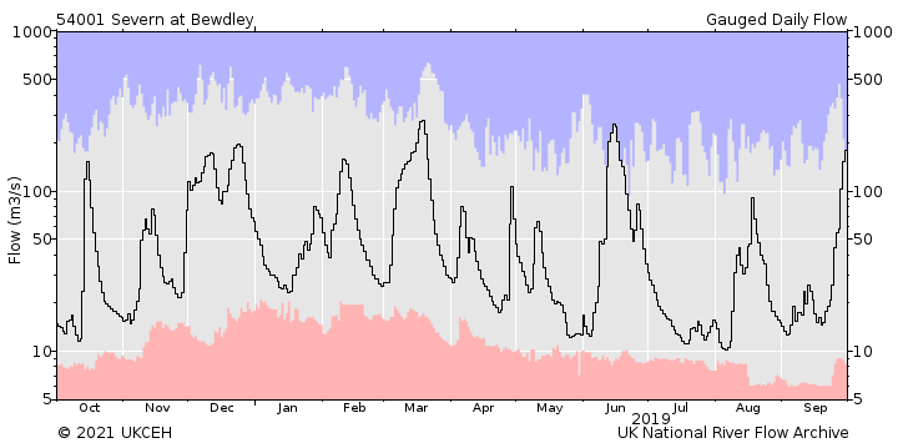
River flow can be graphed as a river hydrograph, which shows how a river flow changes over time. Specialists in this field commonly work with hydrographs, and they can be used to predict river flow variation with the season or short-term flooding events.


Water abstraction
The removal of water (termed ‘water abstraction’) is the removal of water from rivers, lakes, canals, reservoirs, aquifers, an estuary or the sea. Where there is water, there is life. So, we need water to live, for industry, to generate power and to supply our crops. As such, it is necessary to take water from water bodies, permanently or temporarily, to make our lives possible. However, water abstraction must be managed responsibly. After all, it is not just humans on this planet, and lots of flora and fauna share the need for water!
Freshwater is abstracted from all of the major rivers feeding the Severn Estuary. Some uses, such as heavy industry, have declined, though this use has been replaced by other sectors such as agriculture. Most of the freshwater abstraction points are located above the tidal limit, in order to avoid uptake of saltwater. Those close to the tidal limit, such as abstraction from the Severn at Gloucester feeding the Gloucester – Sharpness Canal, must be carefully managed to prevent uptake of saline water. This particular canal also supplies freshwater to much of the Bristol area, meaning it is especially important that saltwater is kept out of this system. There are also abstractions from the Estuary for coastal power stations to be used as cooling water. Oldbury power station uses water from the Severn Estuary for its decommissioning process, where water is stored in the tidal reservoir at Oldbury over periods of low tide. Other energy providers are reducing the amounts of water they abstract, for example Uskmouth power station, where ‘make-up’ water is reused from the nearby Nash wastewater treatment works.
River Severn regulation
During the 1950s, it was found that demand for private and public water supply would become greater than the river could support, especially during dry years. This led to the construction of the Llyn Clywedog dam in Llanidloes, Mid Wales in 1966. The 250 hectare lake boasts stunning scenery on a sunny day in Wales and lies in the upper catchment. The old Bryntail lead mine ruins lie just beneath the dam, peaceful remains of what once was an industrial centre. The Llyn Clywedog dam supplies water which is available for abstraction further downstream, which protects river flows from falling too low.
Recent regulation and management strategies include the Environment Agency’s and Natural Resources Wales’ River Basin Management Plan. Where parts of rivers have been straightened out for fishing or for navigation, this can disrupt the natural path of the river, causing flooding. By creating natural water retention areas, such as wetlands and marshes, the risk of flooding can be reduced. Government agencies work with the water industry to implement long-term strategies to reduce pollution from wastewater and protect sensitive sites for wildlife. These strategies are implemented across the Severn river basin district, which combines local catchments and allows groups to work together effectively.
Climate Change
We are currently updating the content on these web pages to provide you with the latest information and resources. The refreshed pages will be available shortly. Thank you for your patience.
For more information, visit:
Figure references
- S-cool: Hydrology, River regime webpage https://www.s-cool.co.uk/gcse/geography/rivers/revise-it/hydrology
- National River Flow Archive: 54001 Severn at Bewdley https://nrfa.ceh.ac.uk/data/station/meanflow/54001
- Climate Central: Coastal Risk Screening Tool interactive map https://coastal.climatecentral.org/map/11/-0.118/51.4848/?theme=sea_level_rise&map_type=coastal_dem_comparison&basemap=roadmap&contiguous=true&elevation_model=best_available&forecast_year=2050&pathway=rcp45&percentile=p50&refresh=true&return_level=return_level_1&slr_model=kopp_2014
 Severn Estuary Partnership